A Private Partnership · Lanesville, Hunter, New York
Clover House
Hotel & Spa
Clover Road · Hunter, New York
A mountain house named for the road that leads to the door.
A 27-room boutique mountain hotel on 8.7 acres — 1.5 miles from Hunter Mountain.
$100K
Proposed partnership entry
1.5%
Proposed starting ownership
27
Guest rooms
8.7
Acres — two pools
Proposed terms, subject to owner approval and final documentation.
The Deal at a Glance
The Investment Opportunity
A boutique hotel owned and under renovation — partners hold an interest in both the real estate and the hotel operations.
Partners hold an interest in the holding company that owns both the real estate and the hotel business — and at the planned refinancing (~24 months), partners are projected to receive 75–100% of invested capital back while keeping their full ownership. Subject to final documents.
The Opportunity
Vail Impact
Vail's acquisition has significantly increased regional tourism and demand for hotel lodging
Market Demand
In 2023, the Catskills contributed $2.5B in visitor spending in NY State
Lodging Shortage
Greene County reports a shortage of hotel rooms
Activities & Lifestyle
Near skiing, golf, dining, art galleries, festivals, hiking, swimming, and more
State Tourism Ranking
NY is Top 5 in U.S. for travel spending; Greene County leads NY's growth
Growth Outlook
Catskills visitation, events, and demand expected to continue rising
Already in Place & Approved
Facts on the ground — approvals and assets we already have.
Approved
Environmental Review
NYS SEQRA approved — no environmental impact issues
Approved
Site Plan Review
Revised site plan approved by Town of Hunter
What You're Buying
The Existing Property
8.7 acres, 32,700 SF — the most well-known hotel in the area, on this site since the 1950s.
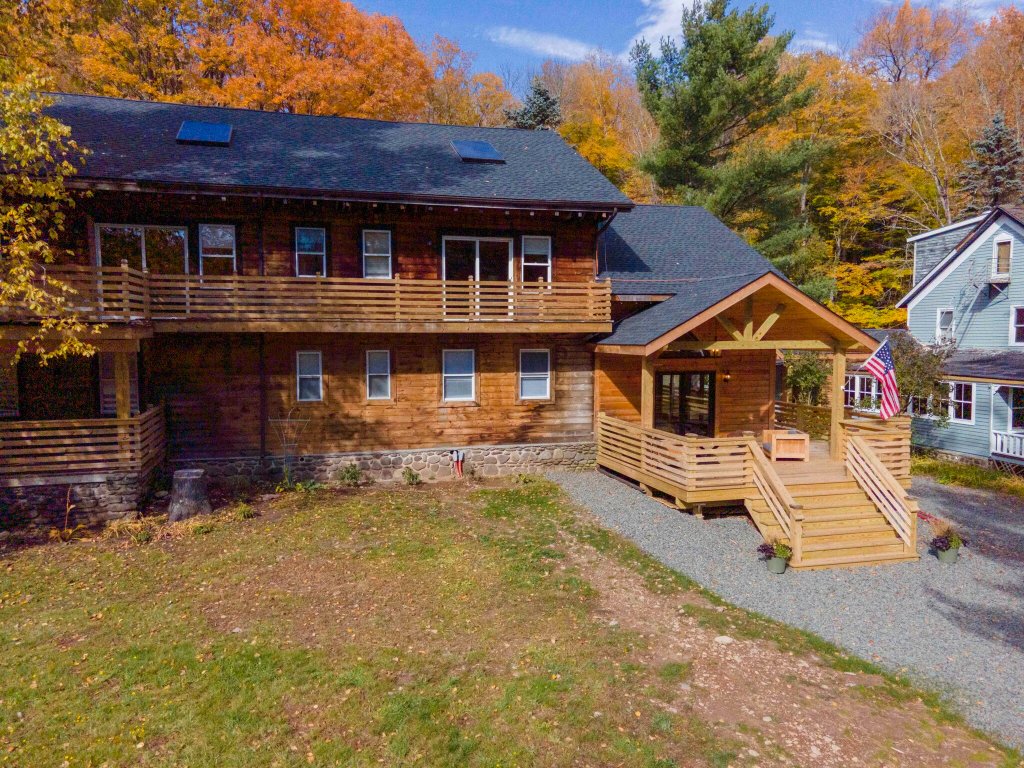
Restaurant & Amenities Building
Take the 3D tour→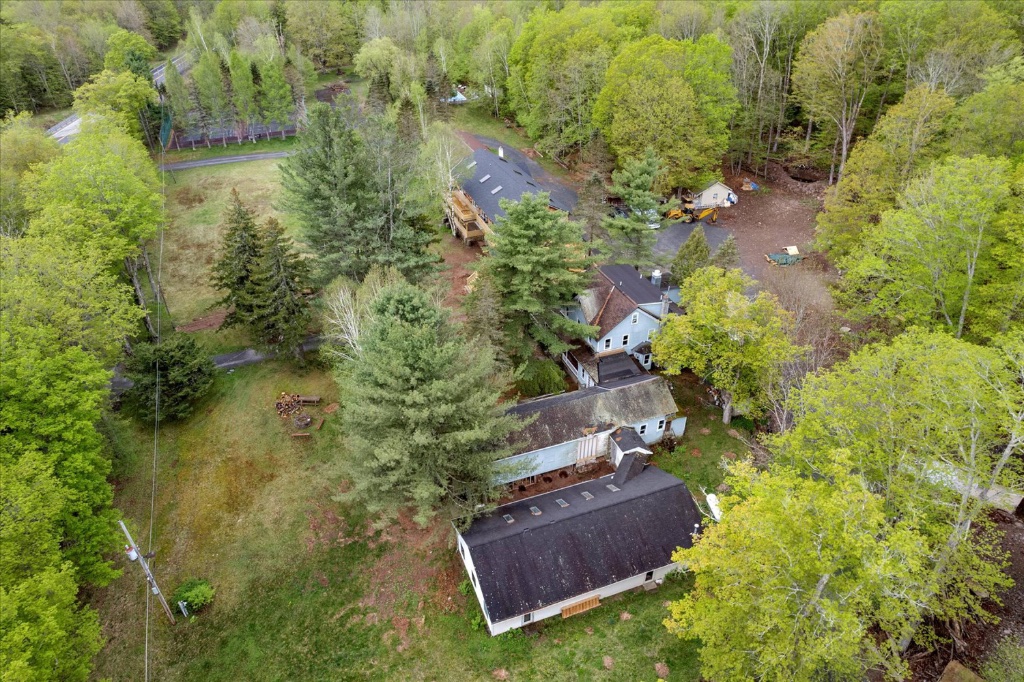
Rooms Building
Take the 3D tour→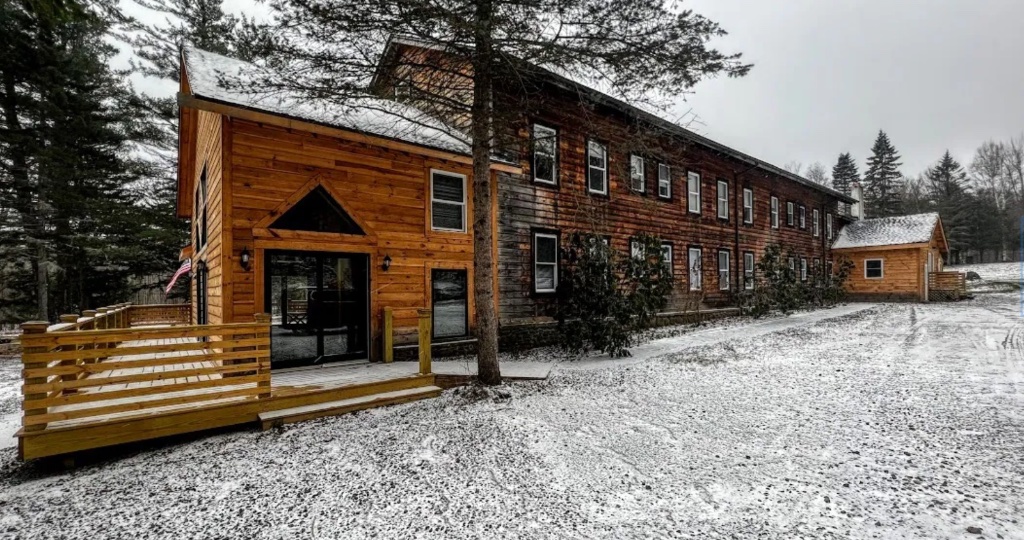
Design Vision
Architectural Renderings
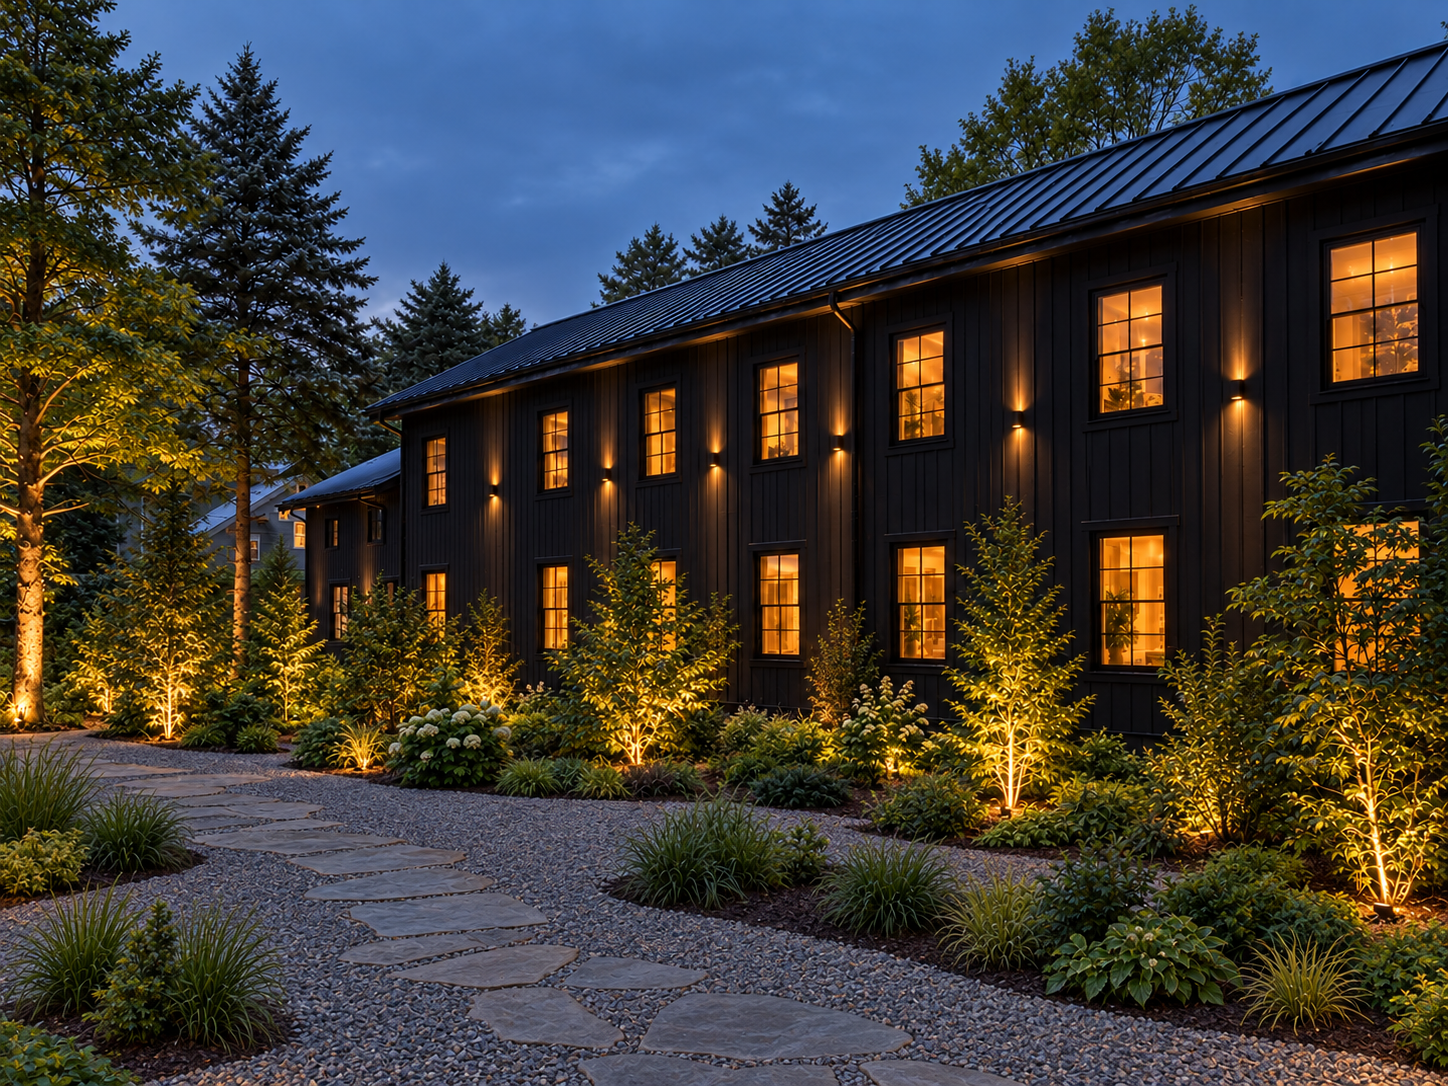
A complete reimagining — from the exterior facade to every guest room, lounge, and spa space.

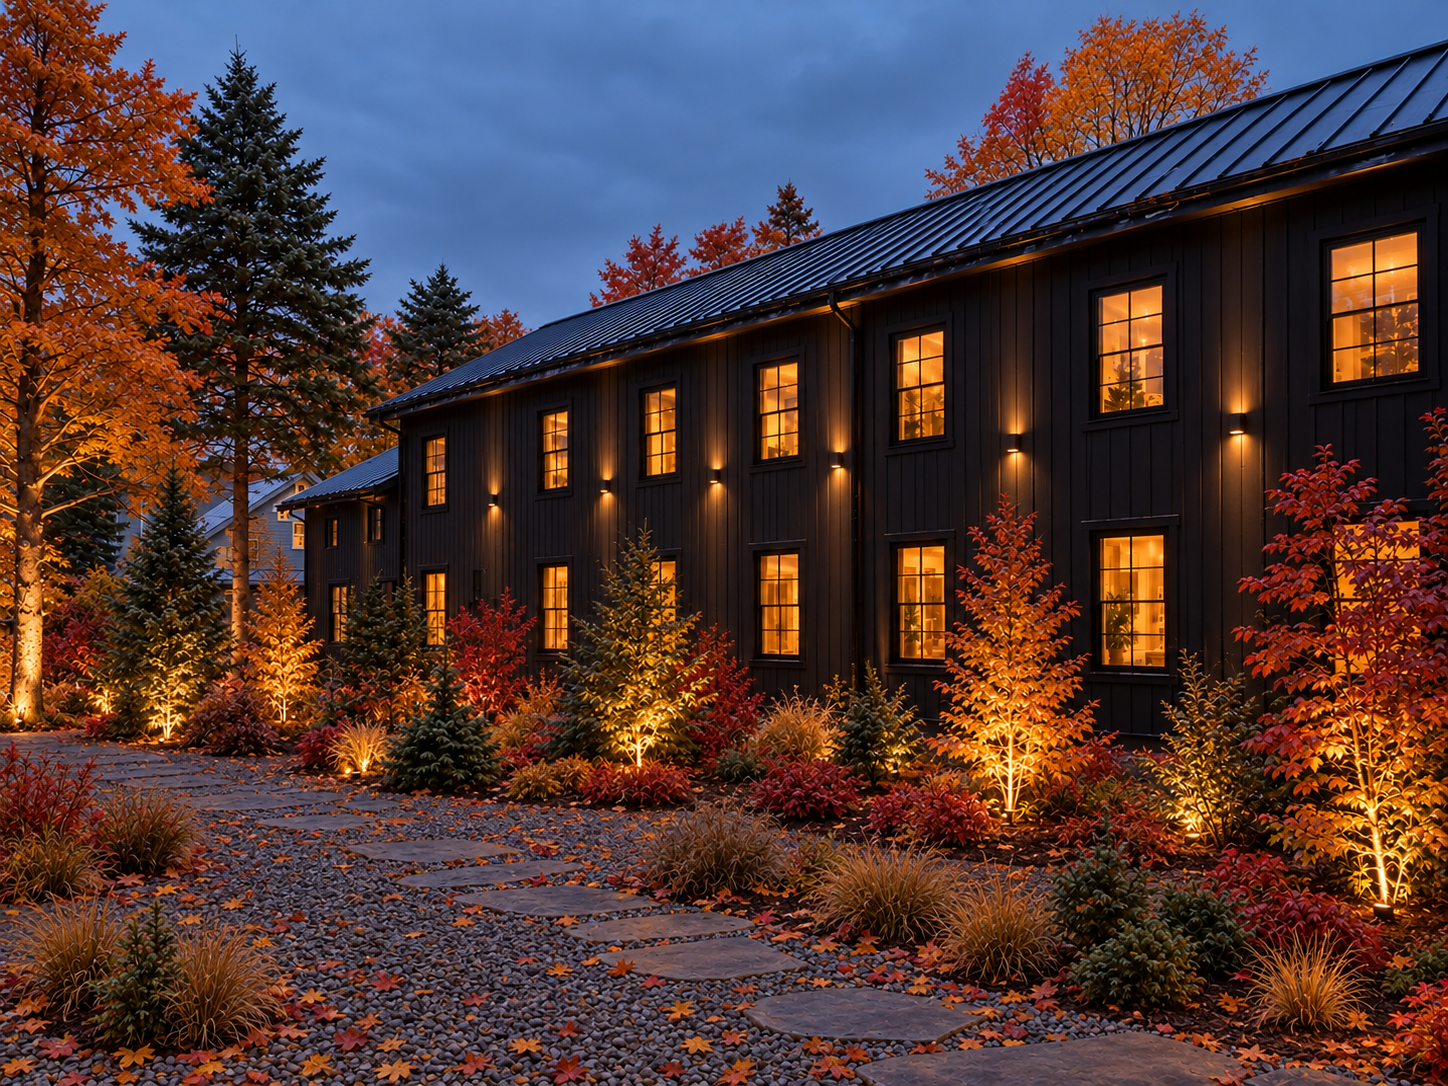
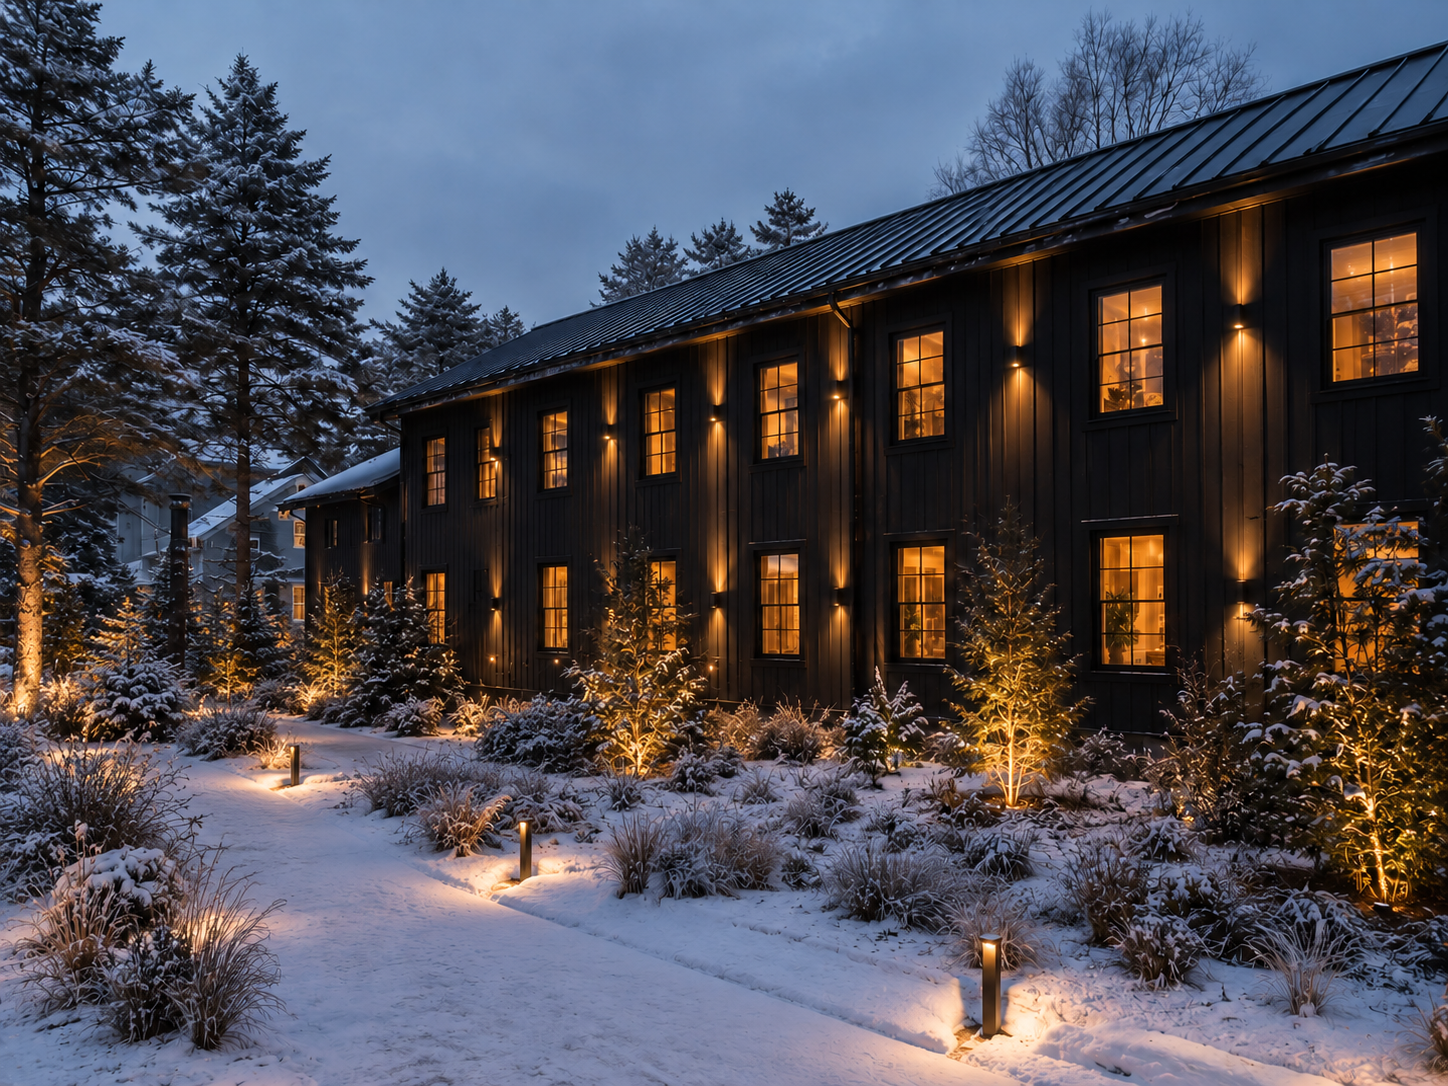
Exterior — main lodge in winter, snow-covered grounds
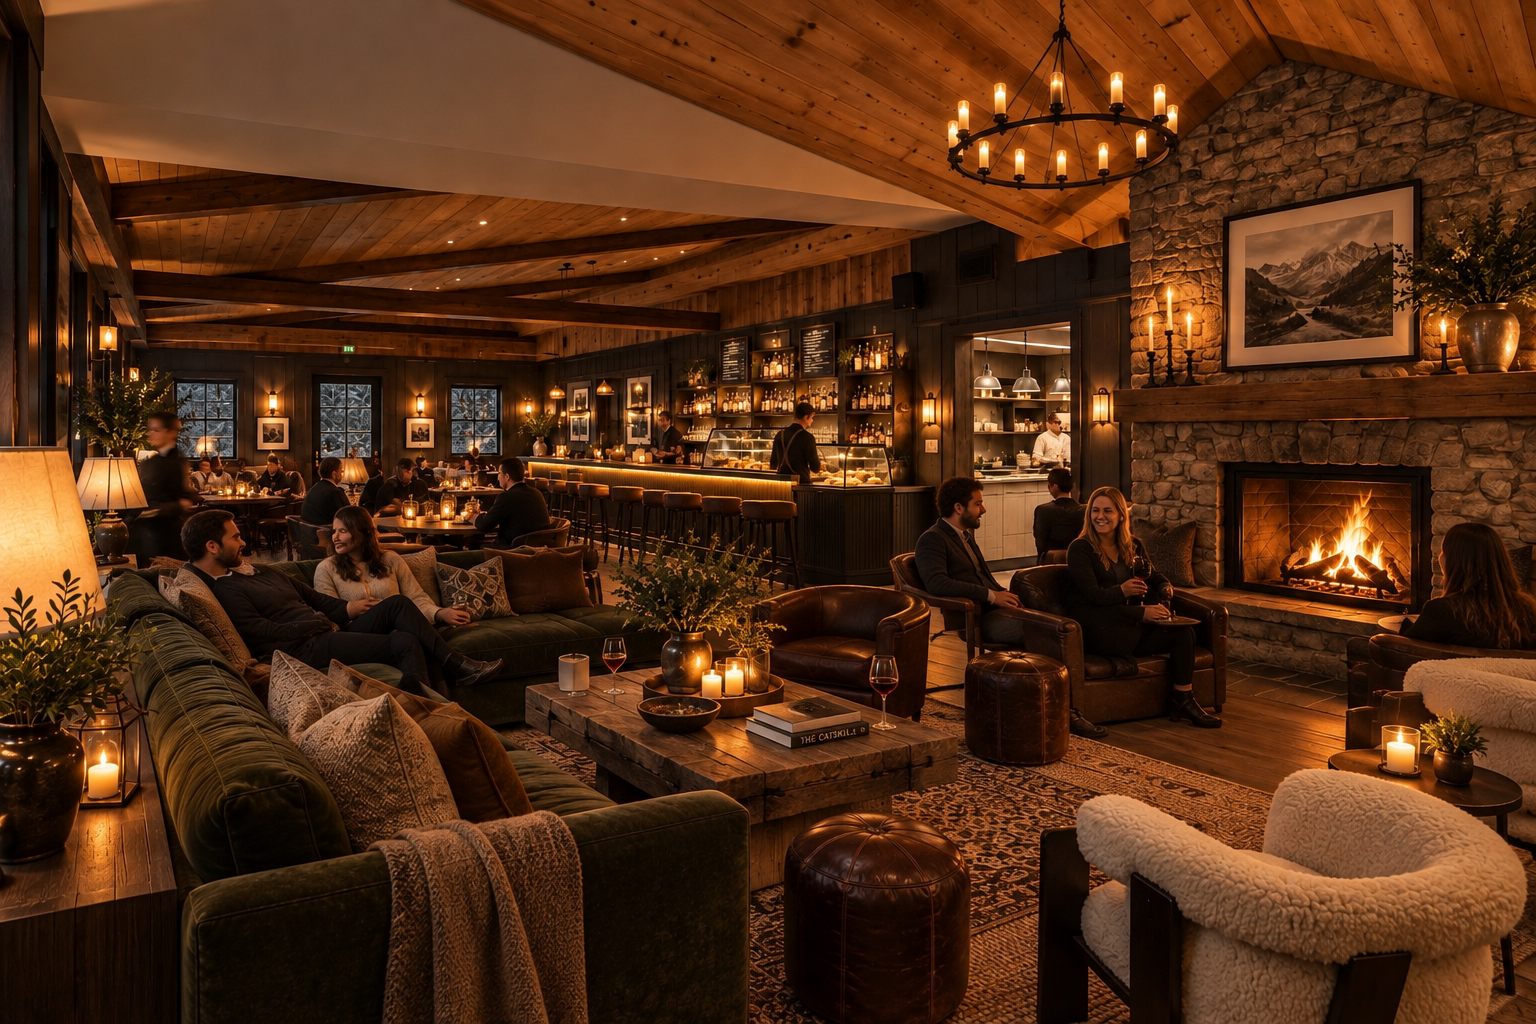
The Interior Direction
Burgundy, Brass & Fireside
Warm wood, leather, and candlelight — a mountain house made for long evenings by the fire.
One Destination. Multiple Revenue Streams.
The Revenue Engines
Guest stays, weddings and private events, and dining create complementary revenue streams. The spa and wellness experience strengthens the property's appeal.
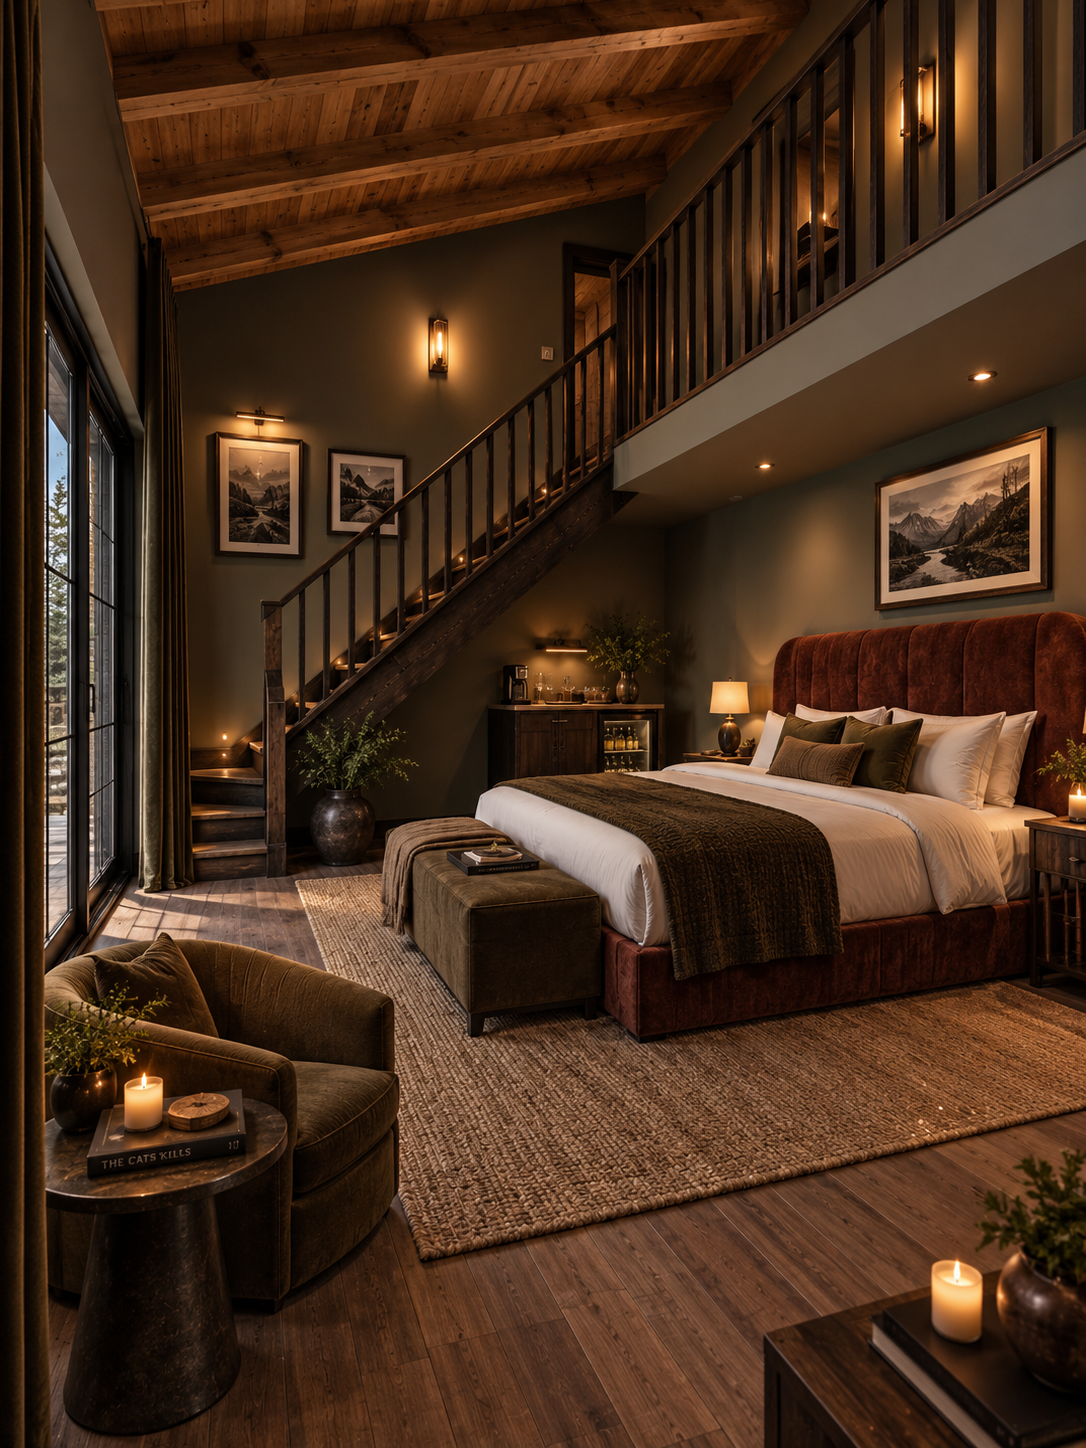
32 Boutique Keys
Burgundy Suites, Mountain Light
Deep burgundy walls, brass, and dark walnut — a members-club intimacy in every key. Rates climb from $275 to $650 ADR as the forest rooms come online, at 55% stabilized occupancy.
32
Keys post-expansion
$275–650
ADR range
$2.5M
Room revenue by Year 3
Weddings & Private Events
A Catskills wedding destination combining celebrations, boutique accommodation, and a full weekend experience.
Weddings & Private Events
A Mountain Destination. A Dedicated Revenue Stream.
Clover House brings celebrations and boutique accommodation together on one Catskills property. Weddings and private events generate venue income while creating additional opportunities for overnight stays, food and beverage, and curated extras.
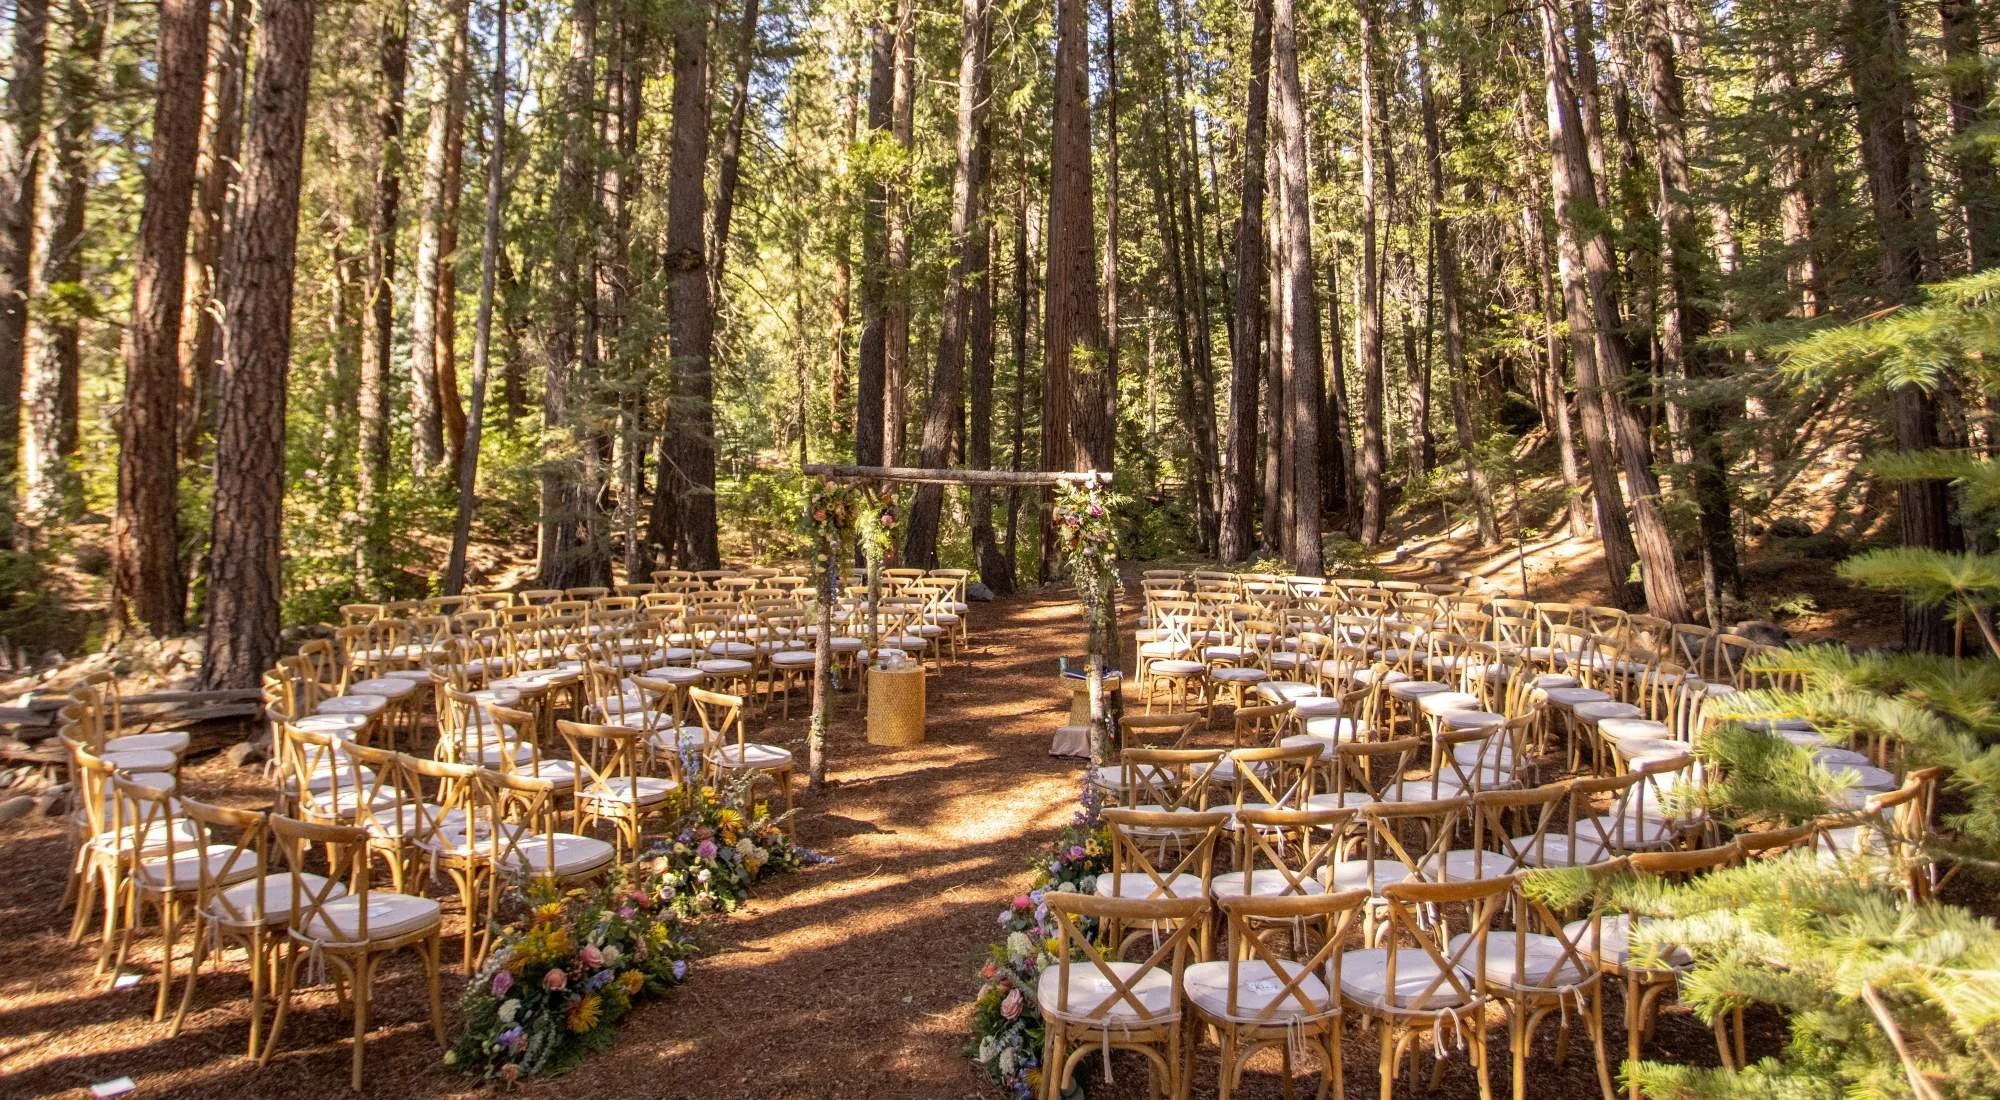
Forest ceremony — wooden arbor framed by pines, cross-back chairs and floral aisles
Venue / Resort Fee
Starting at $35,000 per Event
The fee covers venue use only. Guest rooms, food and beverage, and all extras are priced separately and are not included.
Venue income
A dedicated proposed fee starting at $35,000 per event.
Accommodation revenue
Guest rooms are booked separately, creating additional revenue around each celebration.
Additional revenue
Food, beverage, and curated extras are separately priced.
Illustrative Projection
10 Events × $35,000 = $350,000 in Annual Venue Revenue
Consistent with the existing Year 3 event forecast already included in this presentation — not additional revenue. This is venue revenue before event-related expenses, not net operating income, and excludes guest rooms, food and beverage, and extras.
From welcome gatherings to wedding celebrations and farewell brunches, the opportunity extends across the entire stay.
Weddings and private events are a planned program, launching in Year 2 subject to operating approvals.
Phase Two
Five Premium Forest Cabins
A-frame cabins tucked into the property's woodland — floor-to-ceiling glass, private decks, fire pits. Fully tied into the property's existing electric and septic systems.
$650
ADR / Night
50%
Occupancy / Year
~400
Sq Ft Per Cabin
$75–100K
Build Cost Each
The Math
5 cabins × $650 ADR × 50% occupancy ≈ $593K / year
Self-funded from Phase 1 cash flow · Delivered Year 3
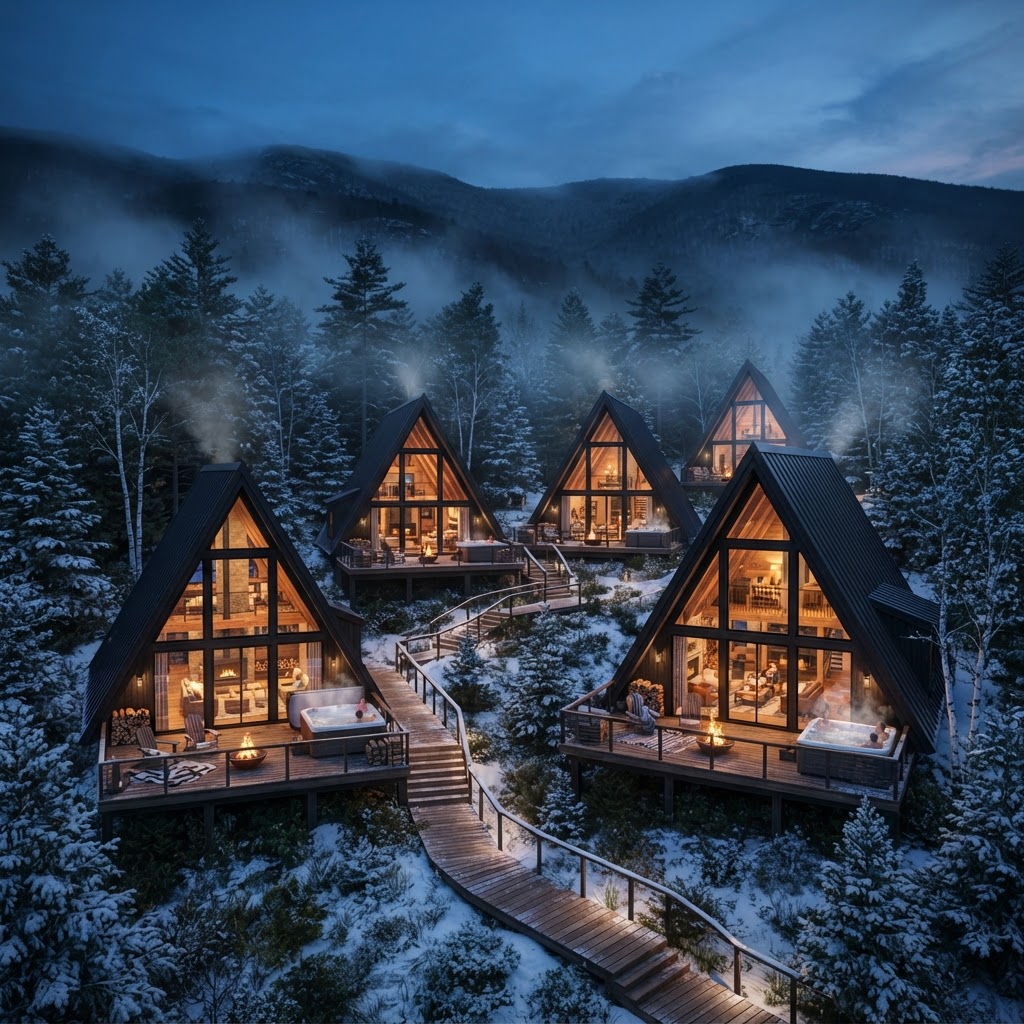
Five A-frame forest cabins glowing at dusk
Room to grow: zoning and septic capacity both allow more than five cabins — each additional unit adds revenue at a predictable $75–100K build cost.
"Where the wilderness becomes your private retreat."
Live Investor Calculator
See Your Investment at Work
Choose your investment amount and see your ownership, your capital return, and your projected profit — instantly.
Your Projected Ownership
1.50%
1.5% per $100,000 · 20% of the project offered
Months 24 – 60
50 – 100%
Projected return of your capital ($50,000 – $100,000)
Months 24 – 36
$17,918
17.92% return on your capital
Projected Annualized IRR
19.28%%
60.36% profit on original investment
Return on your capital, one year at a time
Months 24–60 total: $60,364 · 60.36% of your capital
Months 24 – 36
$17,918
17.92%
First year after the refinance
Months 36 – 48
$19,769
19.77%
Second year of distributions
Months 48 – 60
$22,677
22.68%
Stabilized year
| Investor cash flow | Investment | Mos 0–12 | Mos 12–24 | Mos 24–36 | Mos 36–48 | Mos 48–60 |
|---|---|---|---|---|---|---|
| Initial investment | ($100,000) | — | — | — | — | — |
| Projected return of capital | — | — | $100,000 | — | — | — |
| Operating profit distributions | — | — | — | $17,918 | $19,769 | $22,677 |
| Total cash received / invested | ($100,000) | — | $100,000 | $17,918 | $19,769 | $22,677 |
| Return on your capital | 0.00% | 0.00% | 17.92% | 19.77% | 22.68% |
Projections based on the project's operating model (cap rate 9.0%, refinance at month 24). Return of capital is projected at 50% – 100% of contributed capital depending on the final refinance terms; the cash flow table models the 100% upper end. All figures are projections, subject to assumptions and final documentation.
Property Forecast
Five-Year Operating Forecast
From the project’s financial model. All figures are projections, not results; assumptions are subject to owner confirmation.
| Operating model | Year 1 | Year 2 | Year 3 | Year 4 | Year 5 |
|---|---|---|---|---|---|
| Room revenue | $1,688,125 | $1,688,125 | $2,519,413 | $2,710,125 | $2,981,138 |
| F&B income (net) | — | $150,000 | $200,000 | $300,000 | $350,000 |
| Event revenue | — | $175,000 | $350,000 | $350,000 | $350,000 |
| Total income | $1,688,125 | $2,013,125 | $3,069,413 | $3,360,125 | $3,681,138 |
| Expenses (before debt) | $984,134 | $907,734 | $1,286,572 | $1,453,830 | $1,581,022 |
| NOI before debt service | $703,991 | $1,105,391 | $1,782,840 | $1,906,295 | $2,100,116 |
| Debt service | — | $420,000 | $588,335 | $588,335 | $588,335 |
| Cash flow after debt service | $703,991 | $685,391 | $1,194,505 | $1,317,959 | $1,511,780 |
Offering assumptions
Minimum / pricing unit
$100,000
Ownership per pricing unit
1.5%
Available ownership
20.0%
Management fee rate
8.0% of room revenue
Refinance assumptions (Year 2)
Cap rate (editable)
9.0%
Refinance valuation
$12,282,118
LTV / new loan
60% · $7,369,271
Capital returned to investors
100% of contributed capital
Room mix & rate assumptions
11
King suites
$350 → $400
8
Queen suites
$275 → $325
4
Mezzanine duplexes
$450 → $550
4
Premium duplexes
$500 → $600
5
Forest cabins
$650, from Year 3
Occupancy ramps from 45–50% in the opening years to 55% by Year 5. Total income in the stabilized year is projected at $3.68M; NOI before debt service at $2.10M. Projections from the financial model, not results.
Execution Plan
Strategic Development Phases
A phased opening brings guest rooms into operation first, followed by dining, events, and wellness.
Guest Rooms — Core Opening
Income-Ready Rooms
- •All 27 rooms rebuilt with new bathrooms, windows, wrap-around decks, and full FF&E.
Lounge, Lobby, Kitchen & Bar
The Social Heart
- •Lounge and lobby renovation, commercial kitchen and bar, landscape, fire pits, and site lighting.
Outdoor Pool & Landscape
Season Opening
- •Outdoor pool complete with hot tub, deck seating, and a pedestrian bridge.
Event Space & Site Flow
Flexible Gathering Spaces
- •Gym converted to loft-style event space, with improved entrances, circulation, and lighting.
Indoor Spa & Wellness
Year-Round Wellness
- •Indoor pool, hot tub, dry sauna, steam room, cold plunge, and new showers.
Operations & Management Structure
Personal hospitality. Efficient operations. A seamless guest experience.
Remote Concierge & Guest Services
- •24/7 guest support — handled remotely, never intrusive
- •Seamless digital arrival, supported by remote concierge and an on-site team
- •Concierge, shuttle scheduling & pre-arrival arrangements
Minimal On-Site Staffing
- •Founders on-site in Hunter, NY
- •Small team for housekeeping & property upkeep
- •Discreet presence — guest privacy preserved